
Does it pay? Putting real numbers on solar pumping
Solar Pumping - Part Two
Part One made the case for solar pumping. This instalment tackles the question every operator asks next — would it actually pay for my site? Here's how the economics work, a worked example, and how to get a real number for your own pump.
Size the array to the pump, not the roof
The starting point for a solar pumping system isn't how many panels will fit — it's the pump's load profile: how much power it draws, how many hours it runs, and when. Because peak irrigation demand and peak sun fall in the same months, you can cover a large share of a pump's running hours without massively oversizing the array. The goal is to match the solar to the pump's daytime energy use, not to blanket every last kilowatt-hour.

New Zealand irrigation demand and solar resource both peak in the same summer months. (Indicative)
What actually drives the payback
Four levers do most of the work:
- What you pay for power now. On grid, solar cuts the usage part of the bill (c/kWh) while fixed and line charges stay — so the higher your usage rate, the faster it pays back. On a diesel or generator site, it is the fuel cost solar displaces, which is usually higher still.
- Sun-hours the pump runs. Daytime, seasonal pumping is ideal. A pump that mostly runs at night captures far less solar.
- Array size. A bigger array generates more, but costs more and spills surplus on low-demand days. There's a sweet spot matched to the load.
- Installed cost. The single biggest variable — and the one that keeps falling as solar hardware gets cheaper.
The bottom line: payback is site-specific — but every input above is knowable, which is what makes a proper assessment worthwhile
Four setups, four payback stories
Part One laid out the four ways the SD750SP can power a pump — grid-connected hybrid, fully off-grid, generator-backed, and battery-supported. For the economics, the point is that each setup changes what solar is actually competing against, and that is what sets the payback.
- Grid-connected hybrid. Solar competes with your grid tariff, so the usage rate (c/kWh) drives the return. It is the most common retrofit and the easiest to model straight off a power bill — and it is the case shown in the worked example below.
- Generator or diesel replacement. Here solar competes with diesel, which typically costs far more per kWh than grid power once fuel, servicing and refuelling labour are counted. Because the incumbent cost is so high, paybacks are often shorter than a grid hybrid, and the generator stays on as backup so reliability is unchanged.
- Off-grid where mains would need extending. The comparison is not only running cost — it is the capital cost of getting a line to the site at all. When a grid extension runs into six figures, an off-grid solar-and-drive build can pay for itself on the avoided connection before the first kWh is even counted.
- Battery-supported. Storage stretches pumping into the shoulders of the day or overnight, but it is the most expensive kWh in the system. It earns its place where a longer pumping window has real value, or where it displaces peak-rate grid power or diesel — not as a default add-on.
Most New Zealand sites land on the grid-connected hybrid, which is why the worked example uses it. But if you are replacing a generator, or would otherwise be paying to extend the grid, the numbers often look better than the example suggests, not worse.
A worked example
To show how the pieces fit, here's a mid-size irrigation bore pump on a grid-connected hybrid — the most common setup — with round numbers. Every figure below is an illustrative placeholder — swap in your real tariff, runtime and install quote before this goes anywhere near a customer.
WORKED EXAMPLE — ILLUSTRATIVE ONLY (replace with your real figures) |
|
|
Pump |
55 kW bore pump |
|
Irrigation-season runtime |
~1,600 daytime hours / year |
|
Annual pumping energy |
~90,000 kWh |
|
All-in power price [placeholder] |
30 c / kWh |
|
Current annual pumping cost |
~$27,000 |
|
Solar array [placeholder] |
~80 kWp |
|
Share of pumping energy from solar |
~60% |
|
Estimated annual saving |
~$16,000 |
|
Indicative installed cost [placeholder] |
$100,000 – $140,000 |
|
Indicative simple payback |
~6 – 9 years |
Figures are illustrative only and not a quote. Actual savings and payback depend on your tariff, pump duty, site and install cost.
A day on the drive
The reassurance behind those numbers is that reliability never wavers. On a typical day the pump starts in the early morning drawing mostly from the grid, then hands over to solar as the sun climbs. By midday the array carries the full load and the grid sits idle. When a cloud passes, the drive fills the dip from the grid in a fraction of a second and the pressure setpoint never drops. As the sun fades in the afternoon the grid quietly takes back over, and any night pumping simply runs on grid as it always did. The site operates exactly as before — it just buys a lot less power during daylight.

A typical grid-connected hybrid day: solar carries the midday load and the grid fills the edges. (Illustrative)
The starting point for a solar pumping system isn't how many panels will fit — it's the pump's load profile: how much power it draws, how many hours it runs, and when. Because peak irrigation demand and peak sun fall in the same months, you can cover a large share of a pump's running hours without massively oversizing the array. The goal is to match the solar to the pump's daytime energy use, not to blanket every last kilowatt-hour.
Panels on the pond: floating solar
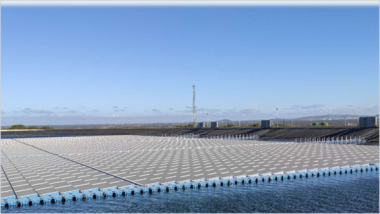
Many pumping sites sit right beside the ideal place for an array — the water itself. Irrigation ponds, dairy effluent ponds, council wastewater lagoons and supply reservoirs can all carry a floating array, with the drive and pump on the bank running straight off it — generating power on water you already control rather than on productive land. The panels run cooler over water, nudging yield up, while shading the surface cuts evaporation and algal growth.
It costs a little more than a ground mount — floats and mooring add capex — and it won't suit a small, shallow or debris-prone pond. But it is proven: New Zealand's first floating array went in on an Auckland wastewater pond back in 2020, helping run that site's own pumping. For a water operation short on spare land and long on pond, it is well worth putting into the assessment.

A floating solar array on an irrigation supply pond, feeding the scheme's pumps. (Power Electronics)
What a good site looks like
Strong candidates: high daytime pumping, a hefty power bill or expensive diesel, good sun, an existing variable speed drive (or a pump suited to one), and room for panels — plus any site where extending the grid would be costly. Weaker candidates: mostly night pumping, small or occasional loads, heavily shaded sites, or very cheap grid power. A quick look at a power bill or fuel spend and a pump schedule usually tells us which camp a site is in.
Getting your actual number
The only way to know your payback is a proper assessment. To put an indicative saving in front of you, we'd need: pump size(s) and type, typical run hours and seasonal pattern, how the site is powered today (grid, generator or diesel, or no connection at all), a recent power bill or fuel spend, site location and space for panels, and your existing drive or switchboard details. From there the PENZ team can model a realistic array size, annual saving and payback range for your specific site.
In the next issue: beyond irrigation — where else solar pumping earns its keep, from rural and municipal water supply to dewatering and industrial process pumping.